- TL;DR
- Paid Media CPL (Cost Per Lead)
- Website Traffic by Traffic Source
- Visitor-to-Lead CVR (Conversion Rate) by Traffic Source
- Time-to-Nurture (Lead-to-MQL, MQL-to-SQL)
- Lead-to-Customer CVR (Conversion Rate)
- Lead Velocity Rate (LVR)
- SQL by Tactic (Inbound vs Outbound)
- LinkedIn Follower Base Growth
- Customer Acquisition Cost (CAC)
- LTV/CAC
- Churn Rate
- ARR and ARR Growth Rate
- Rule of 40
- Magic Number
- Quick Ratio
- BVP Efficiency Score
- Revenue Per Employee
We know the struggle is real. You’ve got a game-changing product, an ambitious vision, and the will to move mountains. But when it comes to showcasing your startup’s worth to venture capitalists (VCs), it’s not always clear which marketing metrics hold the key.
Navigating through the labyrinth of SaaS metrics can be a daunting task. From Monthly Recurring Revenue (MRR) to Churn Rate, Customer Acquisition Cost (CAC), and beyond, each number tells a story about your startup’s performance. But which stories matter most to your potential investors? What are the benchmarks that they’re looking for? And most importantly, how can understanding these metrics help you prioritize your strategies and successfully secure that crucial next round of funding?
That’s where we come in. This comprehensive guide is designed to be your map through the maze. We’ve distilled the ocean of SaaS marketing metrics down to those key figures that VCs really care about. We’ll delve into each one, explaining not just what it represents, but also why it matters, how to track it effectively, and crucially, what good performance looks like.
TL;DR
Understanding SaaS metrics is like holding a magic map to startup success. Key indicators like LTV/CAC, Churn Rate, ARR, and the Rule of 40 show you where you’re winning, and where there’s room for improvement. Crucially, metrics like the Magic Number and Quick Ratio can help you balance growth and efficiency. Remember, these metrics aren’t stand-alone figures – they’re connected and influence each other. Sounds a lot? No worries! Grab our SaaS Metrics Cheat Sheet to keep these insights at your fingertips. And if you want to propel your startup’s growth, look no further than Transcend Digital. We’re turning data into growth stories!
Ready to dive deep? Here’s your guide to the must-track SaaS marketing metrics and the performance benchmarks you’ll want to measure up against.
Paid Media CPL (Cost Per Lead)
This metric reveals how much it costs to acquire a lead through paid media efforts. It’s crucial because it directly relates to your marketing budget and ROI. Potential investors look at this to understand your startup’s paid media program efficiency.
Formula: Total Campaign Cost / Number of Leads Generated
The average cost-per-lead can swing widely depending on factors like the industry you’re in and your chosen go-to-market strategy. It’s not a one-size-fits-all kind of metric!
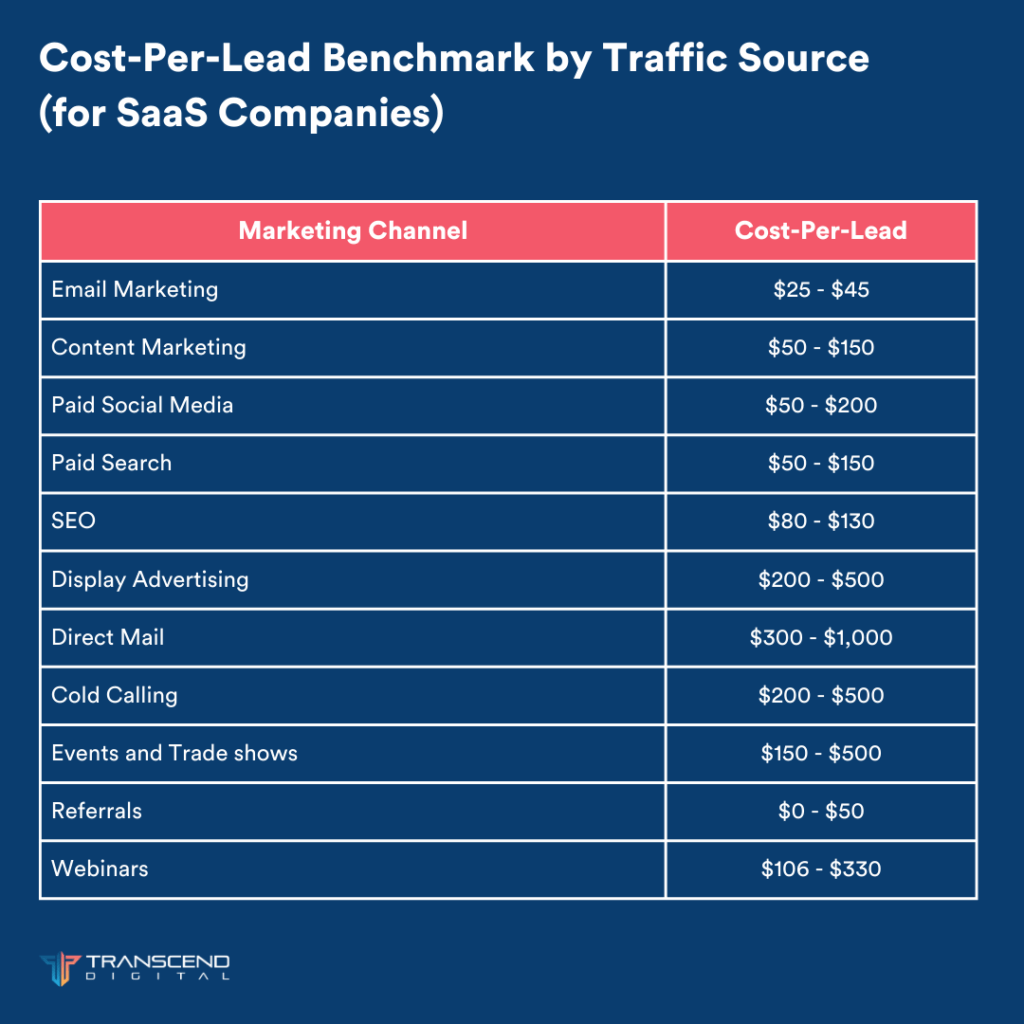
Source: www.sopro.io
Website Traffic by Traffic Source
This metric segments your website traffic based on where visitors are coming from (e.g., organic search, paid ads, social media, etc.). It’s essential to understand which sources are most effective at driving traffic. Potential investors look at this to gauge your digital presence and reach.
Visitor-to-Lead CVR (Conversion Rate) by Traffic Source
This metric measures the percentage of website visitors from each traffic source that convert into leads. It’s calculated by dividing the number of leads generated from a source by the total number of visitors from that source, then multiplying the result by 100 to get the percentage.
Formula: (Number of Leads from Source / Total Visitors from Source) * 100
This metric indicates the effectiveness of your conversion strategies across different channels. Investors use this to evaluate the success of your lead generation tactics.
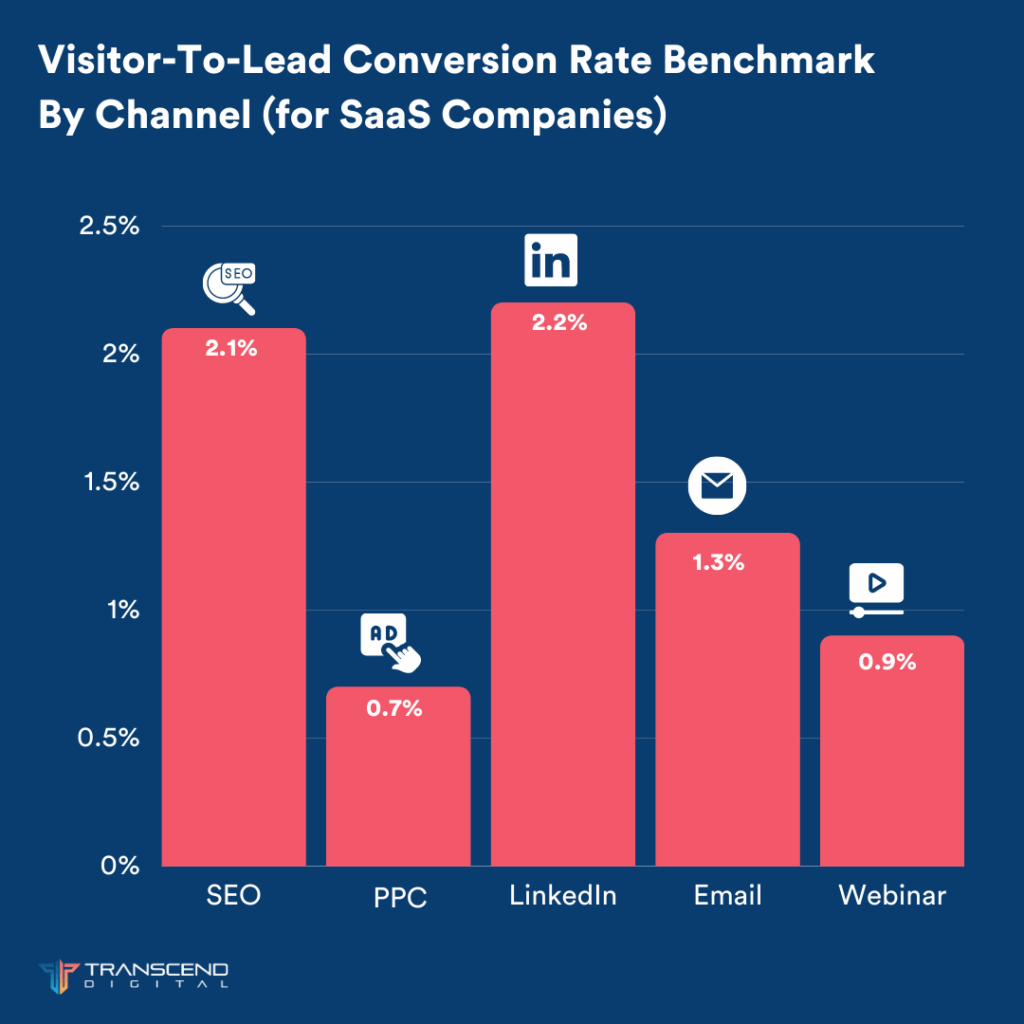
Source: www.firstpagesage.com
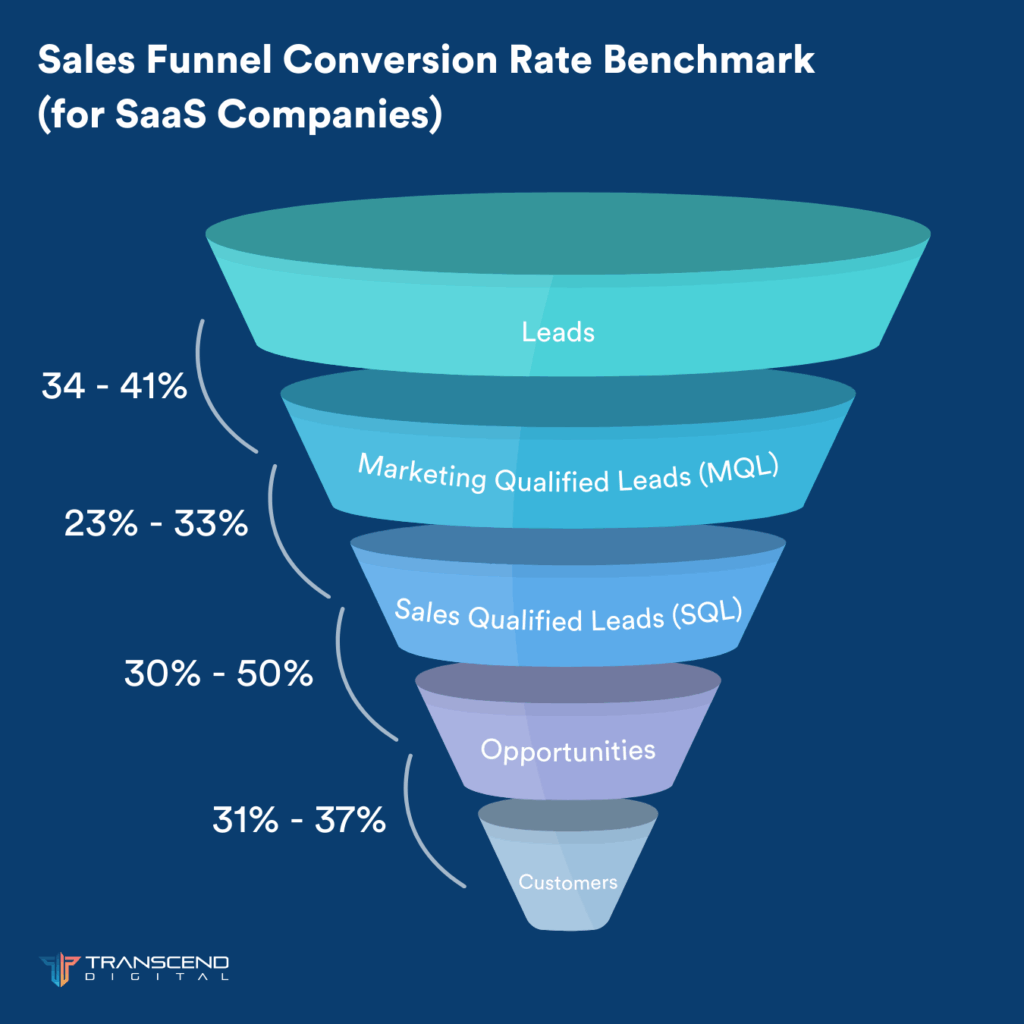
Time-to-Nurture (Lead-to-MQL, MQL-to-SQL)
These metrics measure the time (typically measured in days) it takes to convert a lead to a Marketing Qualified Lead (MQL), and from MQL to a Sales Qualified Lead (SQL). They indicate the efficiency of your lead nurturing process. Investors use this to gauge your sales funnel’s effectiveness.
Further Reading:
- How Most Startups Evaluate Marketing Agencies (and Why This Method is Flawed)
- What is a Good Marketing Budget for a Startup?
- SaaS Go-To-Market Strategies: Tips and Examples for Success
Lead-to-Customer CVR (Conversion Rate)
This measures the percentage of leads that convert to customers. It’s calculated by dividing the number of new customers by the number of leads, and multiplying the result by 100 to get the percentage.
Formula: (Number of New Customers / Number of Leads) * 100
The metric is important because it shows how well your sales process turns potential customers into actual ones. Investors see this as a direct reflection of your sales effectiveness.
The average lead-to-customer CVR for outbound tactics is 0.03% and 0.05% for inbound tactics.
Source: www.intellimize.com
Lead Velocity Rate (LVR)
LVR measures the growth rate of your qualified leads from month to month. It is calculated by subtracting last month’s number of leads from this month’s, dividing the result by last month’s leads, and multiplying by 100 to get a percentage.
Formula: ((This Month’s Leads – Last Month’s Leads) / Last Month’s Leads) * 100
It’s crucial as it gives a clear view of your pipeline’s future and your startup’s potential growth. Investors look at LVR to gauge your growth momentum. Lead Velocity Rate varies significantly depending on the industry, type of product, and target market.
SQL by Tactic (Inbound vs Outbound)
This metric breaks down your SQLs based on whether they’re generated through inbound (content marketing, SEO, etc.) or outbound tactics (cold calling, direct outreach, etc.). It shows the effectiveness of your marketing strategies. Investors use it to evaluate your marketing mix.
LinkedIn Follower Base Growth
This metric measures the growth of your LinkedIn follower base over time. It indicates your brand’s increasing influence and reach on this professional platform.
Formula: ((End Period Followers – Start Period Followers) / Start Period Followers) * 100
It’s calculated by subtracting the follower count at the start of a period from the follower count at the end, dividing the result by the follower count at the start, and then multiplying by 100 to get a percentage.
Potential investors view it as a measure of your social media engagement and branding efforts.
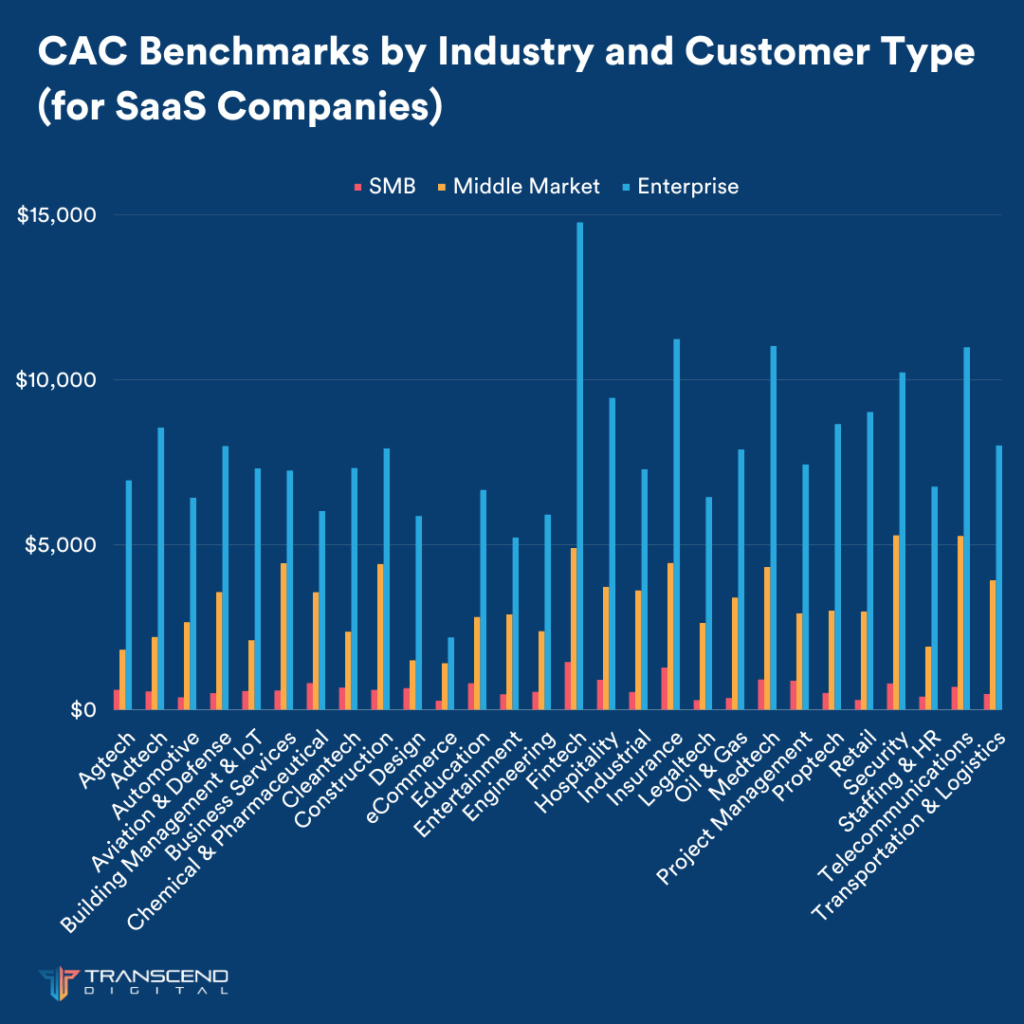
Customer Acquisition Cost (CAC)
CAC is, in simple terms, how much your company spends to gain a new customer. It is a significant metric for any business, but particularly so for startups and SaaS companies, where growth is the name of the game, and every dollar counts. CAC calculates the total cost to acquire a new customer, including all marketing and sales expenses.
It’s calculated by dividing the total costs associated with acquisition by total new customers, within a specific time period.
Formula: Total Acquisition Costs / Total New Customers
The CAC provides a snapshot of the efficiency of your marketing and sales efforts. A lower CAC implies that you’re acquiring customers inexpensively, which can lead to higher profitability, while a higher CAC could indicate that your acquisition strategy needs to be reassessed.
There are several factors that typically feed into the customer acquisition cost. These include:
- The budget you allocate for advertising
- The expense of maintaining your marketing team
- The financial investment in your sales team
- The cost associated with creative work and design
- Technical expenses related to software and infrastructure
- The money spent on publishing and distributing your marketing materials
- Production costs related to creating your product or service
- The cost of managing and maintaining your inventory
While these metrics provide invaluable insights, they don’t exist in a vacuum. Understanding them in isolation can give a skewed perspective of your startup’s performance. To extract their full value and get a holistic picture of your business health, it’s essential to examine them in relation to other key metrics.
Source: www.firstpagesage.com
For example, the Customer Acquisition Cost (CAC) might be seen alongside the Lifetime Value (LTV) of a customer. Comparing these metrics helps you understand if the investment in acquiring customers is worth the value they bring over time. The Annual Recurring Revenue (ARR) sheds light on the stability and predictability of your revenue stream, which is a vital aspect of your financial health. Your go-to-market strategy can significantly impact these metrics, influencing how quickly you acquire new customers and how much you spend in the process.
In the following section, we will explore these interconnected metrics and strategies, and delve into how they work together to provide a complete, accurate, and insightful evaluation of your marketing efforts and business performance.
Additional key metrics for SaaS companies to keep track of:
LTV/CAC
Picture your startup as a fancy new restaurant. The LTV is how much a diner will spend over a lifetime of visits. CAC, on the other hand, is what you spend to get them through the door – the appetizing menu, inviting decor, irresistible specials. You’d want your diner’s lifetime spend (LTV) to be way more than what you invested to attract them, right? Ideally, about three times more. A ratio of 3:1 or more is typically considered healthy, though this can vary by industry.
Formula: LTV / CAC
An LTV:CAC ratio of 1:1 is essentially a break-even scenario – the value generated by your customer precisely matches what you spent to acquire them, leaving you with no profit to show for it. Now, if your LTV:CAC ratio slips below 1:1, alarm bells should start ringing – your business is in the red, and unless you change tack, it’s set to stay there.
Hitting a sky-high LTV:CAC ratio might seem like a win, but it could actually spell trouble for your business. It might be a sign that you’re not investing enough in attracting new customers. So, if you’ve got customers who are bringing you heaps of value, it’s worth reinvesting some of that in attracting even more of them. It’s all about striking that perfect balance!
Churn Rate
Nobody likes losing friends, right? The same goes for customers. Churn rate is like your company’s unfriend button. This measures the percentage of your customers who cancel or don’t renew their subscription during a given period. Lower churn rates are better, as they indicate higher customer retention.
Formula: (Customers at beginning of period – Customers at end of period) / Customers at beginning of period * 100
Benchmark can vary, but for SaaS, a churn rate of 5-7% annually is usually considered acceptable if you’re an established, mature SaaS company primarily targeting enterprise. If you’re earlier stage SaaS business or targeting small business, the acceptable churn rate will be closer to 5% per month.
ARR and ARR Growth Rate
Imagine you’re on a road trip, and ARR is your car’s fuel gauge. It shows how far you can go with the revenue you’re generating annually on autopilot, from subscriptions. It’s like a sign that says, “next gas station 200 miles away.” So, you want your ARR to be as full as possible to ensure your journey (a.k.a., your startup) doesn’t stall mid-way.
Formula: (ARR at end of period – ARR at beginning of period) / ARR at beginning of period * 100
ARR growth Rate measures the annualized increase in recurring revenue from subscriptions. It’s crucial for SaaS companies, as it demonstrates future revenue potential. ARR growth rate benchmark varies by SaaS company ARR tier.
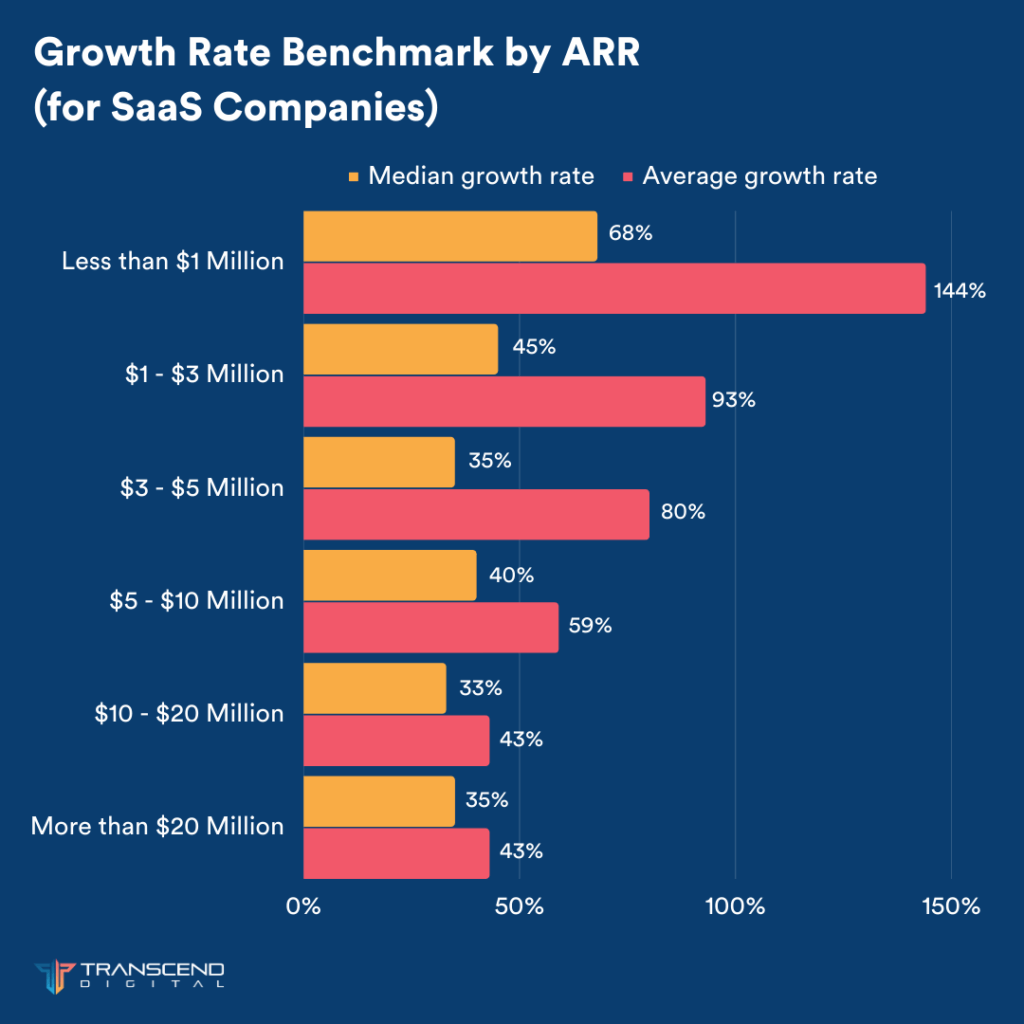
Source: www.saas-capital.com
Rule of 40
It’s the Goldilocks principle of SaaS — you need the right balance of growth and profitability. It’s like the perfect porridge: not too hot, not too cold. The rule states that a SaaS company’s growth rate plus its profit margin should be equal to or greater than 40%. It’s a way of balancing growth and profitability to evaluate a company’s health and efficiency.
Formula: Revenue Growth Rate + Profit Margin ≥ 40%
SaaS businesses clocking in over the 40% mark are cruising on the highway to sustainable profit generation. On the flip side, those falling below 40% could be teetering on the edge of potential cash flow or liquidity challenges.
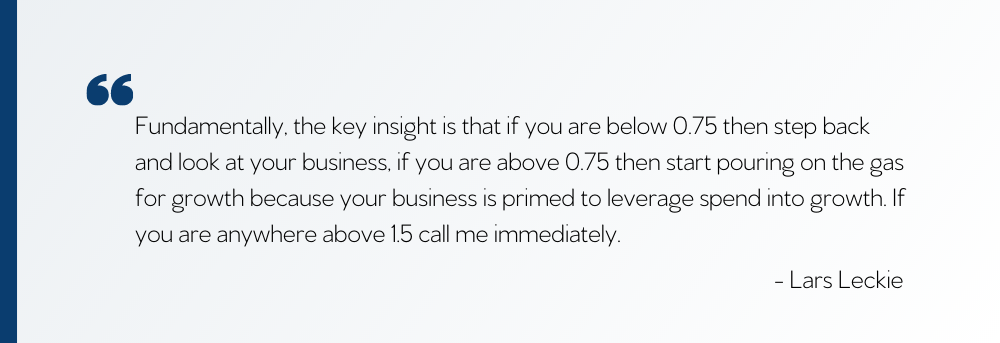
Magic Number
This is a measure of sales efficiency. It looks at the revenue growth from one quarter to the next, compared to the sales and marketing expenses from the previous quarter.
Formula: (This Quarter’s ARR – Last Quarter’s ARR) / Last Quarter’s Sales and Marketing Expense
Aiming for the stars with your SaaS Magic Number is a smart strategy. If you’re hitting anything north of 0.75, give yourself a pat on the back – your sales efficiency is looking mighty healthy. However, a score falling under 0.5 could be a warning bell, indicating potential bottlenecks or inefficiencies in your sales process or business model. And if you’re somewhere in the 0.5 to 0.75 range, it might be time to consider redistributing your resources to fuel growth in other areas.
If your Magic Number is below 0.5:
- Perhaps you’re spending more on bringing in new customers than the revenue they’re generating, and your SaaS pricing structure just isn’t cutting it in covering those costs.
- Or maybe, your SaaS solution isn’t quite hitting the sweet spot with your target market.
- Also, a higher churn rate might suggest that your product needs a bit more polish.
However, there could be times when a lower Magic Number is just part of the growth journey. Especially if your business is in hyper-growth mode, heavily investing in sales and marketing to carve out a sizable chunk of the market share.
Quick Ratio
This metric compares the added recurring revenue and upsells against churn. The SaaS quick ratio “holy grail” most companies have their eyes on is 4.0 – that’s the bullseye they’re aiming to hit, if not exceed.
Formula: (New MRR + Expansion MRR) / Churned MRR
When a SaaS firm nails a quick ratio of 4.0 it means for every dollar they’re losing from churn or contraction, they’re taking in four dollars in revenue. It’s like losing a nickel but finding a twenty dollar bill!
BVP Efficiency Score
This is a comprehensive metric introduced by Bessemer Venture Partners. Think of it as your startup’s SAT score. It looks at everything from your recurring revenue to your gross margin and sales efficiency.
According to Bessemer Venture Partners, the best Bessemer Efficiency Score is greater than 1.5x, with “better” companies falling in the range of 0.5-1.5.
Formula: Net New ARR / Net Burn
Net New ARR = New ARR + Expansion ARR – Churned ARR
Net Burn = Revenue – Operating Expenses
Revenue Per Employee
This tells you how much each team member is contributing to the company’s revenue. The higher, the better.
Formula: Total Revenue / Total Number of Employees
Companies with $1 million to $3 million in ARR have a median ARR per employee of $75,000, whereas more mature SaaS businesses with more than $20 million in ARR have a median ARR per employee of $176,000.
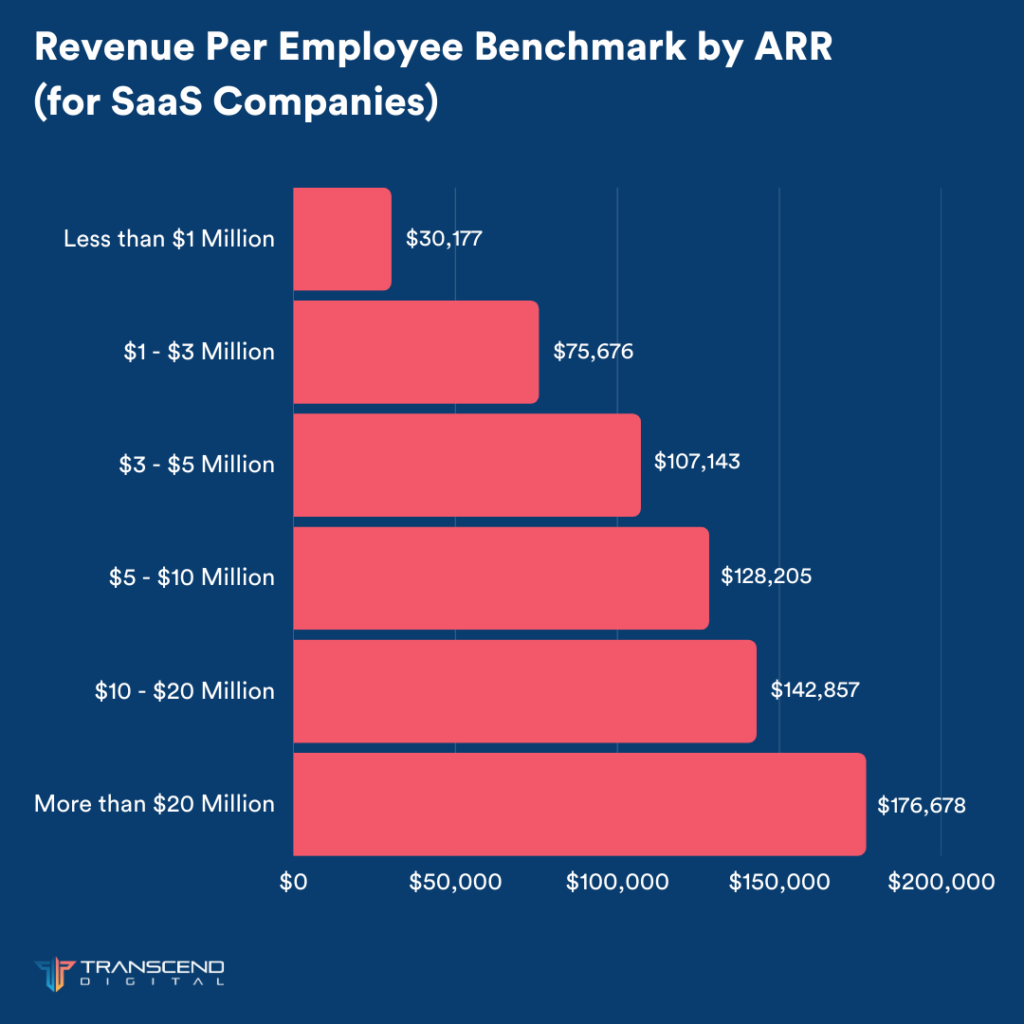
Source: www.saas-capital.com
But wait, there’s more! We know these metrics can feel like a mouthful, and keeping track of them all might seem like juggling flaming swords. Don’t sweat it! We’ve whipped up a handy SaaS Metrics Cheat Sheet just for you. It’s got all these metrics, their meanings, and benchmarks neatly packed into a downloadable guide. Grab your cheat sheet now.
At Transcend Digital, we’re experts at building scalable and effective lead and sales generation funnels, fine-tuned to the unique needs of SaaS companies. We don’t just deliver numbers, we deliver growth. Looking to boost sales and reduce CAC for your SaaS venture? Reach out to us!